
Pocket Boss needs you to mess around with pie charts, line charts, and other workplace data to make the company look good.
You’re a remote worker whose job involves taking information about the company’s productivity, employee happiness, earnings, and other things and turning them into handy charts that make it easy to see how well the business is doing. The trouble is that the business isn’t doing that great, so when these numbers are laid out properly, so you’ll need to tweak things a bit in order to project the image of success that your boss is looking for.
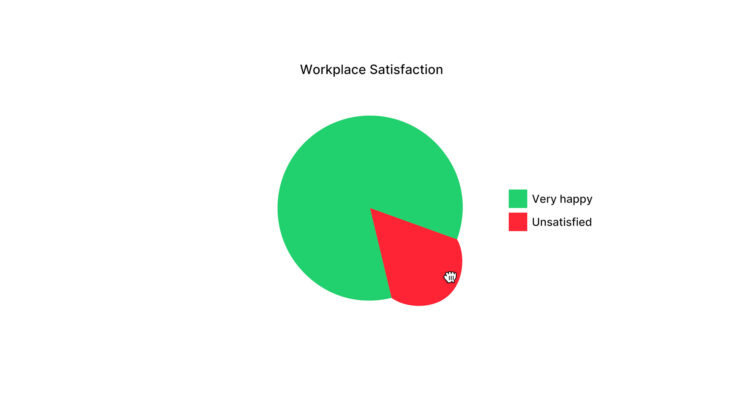
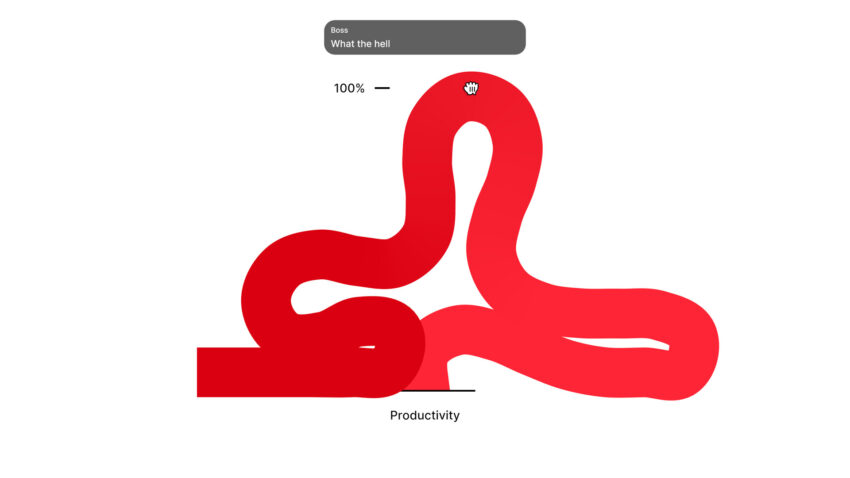
Thankfully, fudging the numbers is playful and fun. If the column chart showing your earnings is a bit low, you can always grab a column and yank it up a little bit. If your pie chart isn’t making your staff look especially pleased with their workplace environment, you can squish that little section of unhappiness down so that investors will be happier with your “results”. That said, there are a couple of little twists to adjusting these charts that can bring some much-needed humor to business data. Sometimes that section of the pie chart just won’t tolerate you messing with it and you’ll need to put some effort into chasing it down. The columns might get a little long and floppy if you make your profits look far too good. And your boss will make sure you hear about it once you turn in your results. But given how much you’re instructed to lie about the business, neither of you will probably be working for long.
Pocket Boss took something I figured woul be interminably dull – company data sheets – and created some charming, funny puzzles out of it. It’s fairly short, too, making it a massive improvement overall on creating business data sheets and tables.
Pocket Boss is available now on the App Store, Google Play, itch.io, and Steam.